Facebook Ad Performance Benchmarks by Vertical in 2026: CPM, CTR, and Creative Lifespan Data for Media Buyers
Every media buyer asks the same question before scaling: "Is this performance good or terrible for my vertical?" Without reliable Facebook ad benchmarks for 2026, you are budgeting blind — overpaying for clicks in verticals where CPCs should be half, or celebrating a CTR that actually underperforms your category average by 40%.
This guide breaks down the latest CPM, CTR, CPC, and creative lifespan data across major industry verticals. More importantly, it shows you how to move from passive benchmarking to active competitive intelligence — because knowing the average is useful, but knowing why specific competitors beat that average is what actually moves your ROAS.
Whether you run ecommerce, SaaS, gaming, or lead-gen campaigns, these numbers give you the baseline. The tactical sections that follow show you how to act on them.
Why Facebook Ad Benchmarks Still Matter in 2026
Benchmarks are not vanity metrics. They serve three critical functions for performance marketers:
- Budget planning — CPM and CPC benchmarks by vertical let you forecast spend accurately before committing budget. If your vertical's average CPC is $0.70 but you are paying $1.50, something in your targeting or creative strategy needs attention.
- Performance diagnosis — A 1.2% CTR means nothing in isolation. In Shopping and Gifts, that is below average. In Finance, it is above. Context determines whether you optimize or scale.
- Creative strategy calibration — Knowing average creative lifespan by vertical helps you plan refresh cycles. If competitors in your space rotate creatives every 14 days, running the same ad for 45 days is a fatigue risk.
The challenge is that most benchmark reports give you cross-industry averages that flatten the nuance. A media buyer running insurance lead-gen campaigns has almost nothing in common with someone running dropshipping traffic campaigns — yet both get lumped into the same "average Facebook CPC" figure.
That is why vertical-specific data matters, and why smart buyers supplement benchmarks with competitive intelligence tools.
Facebook Ad CTR Benchmarks by Industry in 2026
Click-through rate remains the clearest signal of ad-audience fit. Meta's algorithm rewards high-CTR ads with lower CPMs, making CTR optimization a cost lever, not just an engagement metric.
Based on 2025 data from WordStream's analysis of over 1,000 campaigns and 2026 projections, here are the CTR benchmarks for Facebook traffic campaigns by vertical:
High-CTR Verticals (above 2.0%)
- Shopping, Collectibles & Gifts: 4.13%
- Travel: 2.76%
- Sports & Recreation: 2.60%
- Arts & Entertainment: 2.10%
Mid-Range CTR (1.3–2.0%)
- Beauty & Personal Care: 1.81%
- Attorneys & Legal Services: 1.76%
- Personal Services: 1.70%
- Real Estate: 1.68%
- Restaurants & Food: 1.67%
- Animals & Pets: 1.64%
- Health & Fitness: 1.63%
- Education & Instruction: 1.45%
- Automotive — For Sale: 1.48%
- Furniture: 1.39%
- Business Services: 1.38%
- Industrial & Commercial: 1.36%
Low-CTR Verticals (below 1.3%)
- Apparel / Fashion & Jewelry: 1.29%
- Home & Home Improvement: 1.28%
- Finance & Insurance: 0.98%
- Physicians & Surgeons: 0.83%
- Automotive — Repair & Service: 0.80%
 Facebook ad CTR benchmarks vary significantly by vertical — knowing your industry baseline is the first step to optimization.
What Drives CTR Differences Between Verticals
The pattern is not random. High-CTR verticals share characteristics:
- Impulse-friendly products — Shopping, Travel, and Entertainment ads work because users do not need to be "in market" to click. A compelling deal or destination triggers immediate curiosity.
- Visual appeal — Verticals with naturally photogenic products (food, travel, fashion) tend to generate more thumb-stopping creatives.
- Low commitment click — Browsing a travel deal or shopping collection feels low-risk compared to clicking on an insurance quote or surgeon's ad.
For low-CTR verticals, the insight is not that your ads are bad — it is that your audience requires more intent-driven targeting. Finance and healthcare buyers need to be in an active consideration phase before they will click, which makes audience precision more important than creative volume.
For Lead Campaigns: Different CTR Expectations
Facebook Lead Ads tell a different story. The overall average CTR for leads campaigns in 2025 was 2.59% — significantly higher than traffic campaigns because lead forms reduce friction.
Key lead campaign CTR benchmarks:
- Overall average: 2.59%
- Top-performing verticals often exceed 3.0%
- Average conversion rate (form completion): 7.72%
- Average cost per lead: $27.66
The takeaway: if you are running lead-gen and your CTR is below 2%, your creative or targeting likely needs work. If it is above 3%, focus your optimization on form completion rate and lead quality instead.
CPM and CPC Benchmarks: What Media Buyers Should Expect
Cost metrics determine whether your CTR advantage actually translates to profitable campaigns.
CPC by Campaign Type
Traffic Campaigns:
- Cross-industry average CPC: $0.70 (down 6.67% year-over-year)
- This is significantly cheaper than Google Ads' average CPC of $5.26
- Most verticals fall in the $0.50–$1.00 range for traffic objectives
Lead Campaigns:
- Cross-industry average CPC: $1.92 (up 2.13% year-over-year)
- Still dramatically cheaper than Google Ads lead campaigns
- High-value verticals (legal, finance, B2B) trend higher at $2.50–$4.00+
CPM Projections for 2026
CPM varies more dramatically by vertical than CPC because it reflects both competition intensity and audience value:
- Low CPM verticals ($5–$10): Entertainment, retail, broad consumer products. High audience pools keep costs down.
- Mid-range CPM ($10–$20): Health & fitness, beauty, education, real estate. Moderate competition with defined audiences.
- High CPM verticals ($20–$40+): Finance, insurance, legal, B2B SaaS. Smaller audiences with high customer lifetime value drive aggressive bidding.
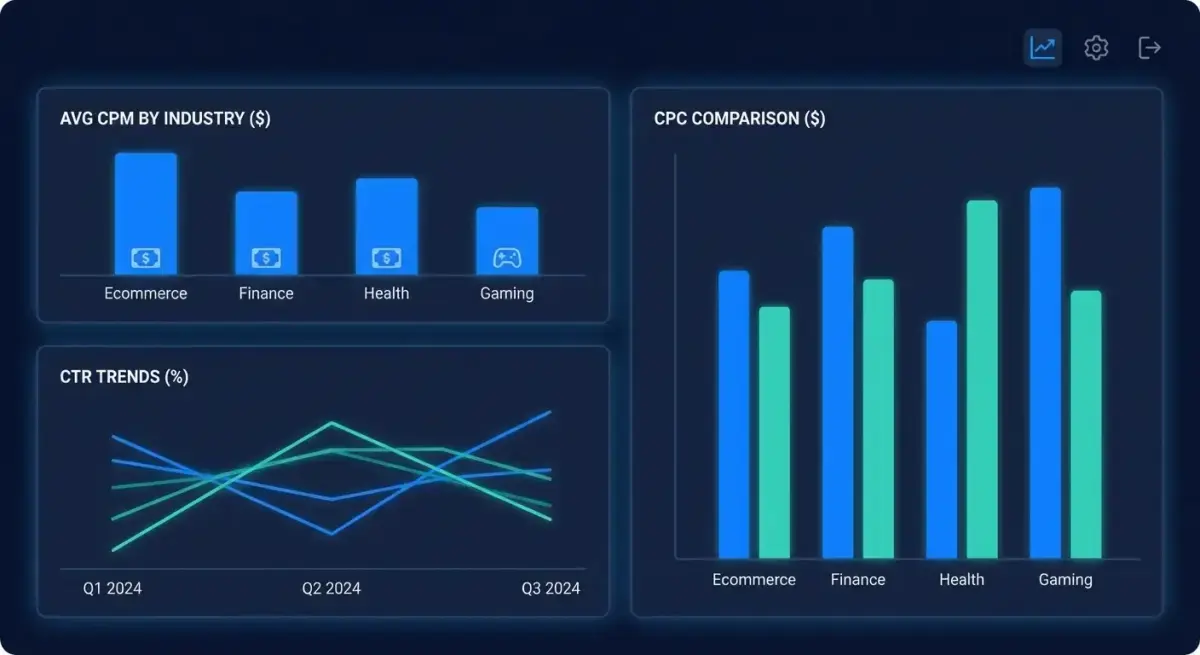
 CPM and CPC ranges differ dramatically between verticals — plan your budget expectations accordingly.
CPL: The Bottom-Line Metric
For lead-gen campaigns, cost per lead is what ultimately matters:
- Overall average CPL: $27.66 (up 20.94% year-over-year)
- Service verticals (home services, construction, healthcare): $30–$50+
- Lower-intent verticals (retail, entertainment): Often below $20
- Compared to Google Ads average CPL of $70.11, Facebook remains significantly more cost-effective
The 20% CPL increase in 2025 is notable but context-dependent. Increased competition and privacy restrictions are pushing costs up across all platforms. The key question is not whether CPL is rising — it is whether your CPL stays below your cost-per-acquisition ceiling for the vertical.
Creative Lifespan Data: When Ads Stop Working
One of the most underutilized benchmarks is creative lifespan — how long an ad creative maintains performance before fatigue sets in. This data point directly impacts your production cadence, testing budget, and scaling decisions.
Average Creative Lifespan by Vertical
Creative fatigue timelines vary by vertical based on audience size, frequency, and competitive density:
- Fast fatigue (7–14 days): Verticals with small audiences and high ad frequency — B2B SaaS, niche professional services, hyper-targeted local campaigns
- Medium fatigue (14–28 days): Ecommerce, health & fitness, beauty, education — moderate audience sizes with regular competitor creative turnover
- Slow fatigue (28–60+ days): Broad consumer categories, entertainment, travel — large audience pools where the same ad can reach fresh users for weeks
Signals That a Creative Is Fatiguing
Do not wait for ROAS to collapse before refreshing creatives. Watch for these early indicators:
- CTR declining 15–20% from peak while impressions remain stable
- Frequency exceeding 2.5–3.0 within a single ad set
- CPM increasing 10%+ without audience or bid changes
- Comment sentiment shifting — "I keep seeing this ad" signals are the loudest fatigue indicator
How Competitor Data Extends Creative Life
Here is where benchmarks reach their limit. Knowing that your vertical's average creative lifespan is 21 days tells you when to refresh — but not what to refresh with.
This is the gap that competitive intelligence fills. By analyzing which competitor creatives have been running for 30, 60, or 90+ days, you can reverse-engineer the elements that resist fatigue:
- What format are they using? (Video tends to last longer than static images)
- What hook pattern keeps engagement high over time?
- Are they using iterative variations of the same concept, or completely different angles?
Want to see which creatives in your vertical have the longest lifespan? Start analyzing competitor ads for free with Adligator
How to Use Spy Tools to Go Beyond Averages
Benchmarks answer "how am I doing?" Spy tools answer "how are the best in my vertical doing, and what can I steal?"
Here is a practical framework for turning benchmark data into competitive advantage:
Step 1: Establish Your Baseline
Pull your own metrics from Meta Ads Manager for the last 90 days:
- Average CTR by campaign type
- Average CPC and CPM
- Creative lifespan (days from launch to when you paused due to declining performance)
- Format mix (% video vs. image vs. carousel)
Compare these against the vertical benchmarks in this article. Identify where you are above, at, or below average.
Step 2: Identify Top Performers in Your Vertical
Use an ad spy tool to filter competitor ads by:
- Your vertical/niche keywords
- Days active: 30+ (to find creatives that have beaten fatigue)
- GEO and language matching your target markets
- Format type to compare against your mix
Ads running for 30+ days with consistent delivery are strong signals of above-benchmark performance. These are the creatives worth studying.
Step 3: Analyze the Patterns
For each long-running competitor creative, document:
- Hook type — Question, statistic, pain point, benefit-first?
- Visual style — UGC, studio-shot, motion graphics, text overlay?
- CTA alignment — Soft (learn more) vs. hard (shop now, sign up)?
- Copy length — Short punchy vs. long-form storytelling?
Step 4: Build Your Creative Brief
Use the patterns you identified to inform your next batch of creatives. The goal is not to copy — it is to understand which structures perform in your vertical and adapt them to your brand.
 Use Adligator's days-active filter to identify creatives that have beaten fatigue — a strong signal of above-benchmark performance.
Key Trends Shaping Facebook Ad Performance in 2026
Several macro trends are shifting benchmarks this year. Understanding them helps you anticipate changes rather than react to them.
AI-Driven Optimization Is Raising the Floor
Meta's Advantage+ campaigns and AI bidding are making average performance better across the board. The 8.23% year-over-year CTR improvement in traffic campaigns is partly driven by better algorithmic audience matching. For media buyers, this means:
- Baseline performance is improving even without manual optimization
- The gap between "good" and "average" is narrowing
- Differentiation increasingly comes from creative quality, not targeting precision
Privacy Changes Continue to Impact Targeting
iOS privacy updates and broader signal loss mean less precise interest-based targeting. The result is modestly higher CPMs in some verticals where detailed targeting was a key advantage. Media buyers compensating by:
- Leaning into broad targeting with strong creatives
- Using first-party data and customer lists more aggressively
- Relying on Meta's algorithm to find converters rather than manually building audiences
Video Continues to Dominate
Video ads consistently deliver higher CTR and longer creative lifespans than static images. Key format benchmarks:
- Video ads: Average CTR ~1.5–2.0% for traffic campaigns
- Image ads: Average CTR ~0.88% (per Lebesgue benchmarks)
- Carousel ads: Performance varies but often outperforms single images
- Creative lifespan: Video creatives typically last 1.5–2x longer than static
If your creative mix is still image-heavy, shifting even 30% of production budget to video is likely to improve multiple metrics simultaneously.
Rising Costs Are Vertical-Specific
Not all verticals are seeing cost increases equally:
- Highest cost pressure: Legal, finance, B2B — where high LTV drives aggressive bidding
- Moderate pressure: Ecommerce, health, education — growing competition but large audiences buffer CPM increases
- Stable or decreasing: Broad consumer, entertainment, retail traffic — large audience pools and improved algorithmic efficiency offsetting competition
Common Benchmarking Mistakes Media Buyers Make
Avoid these pitfalls when using benchmark data for campaign decisions:
Comparing Against Cross-Industry Averages
A "good" CPC in legal ($3.00) would be terrible in retail ($0.50). Always compare within your specific vertical and campaign type.
Ignoring Campaign Objective Differences
Traffic campaign CTR benchmarks are not comparable to lead campaign CTR benchmarks. A 1.7% CTR on traffic is average; the same on leads would be below average (where 2.59% is the norm).
Treating Benchmarks as Targets Instead of Baselines
Benchmarks tell you where the average sits. Your goal should be to beat the benchmark, not match it. If the average CTR in your vertical is 1.6%, aim for 2.0%+ and use competitive intelligence to understand what top performers do differently.
Not Accounting for Seasonality
Benchmarks are typically annual averages. Q4 CPMs can spike 30–50% in ecommerce verticals due to holiday competition. Adjust your expectations by quarter, not just by vertical.
Benchmarking Without Acting
The biggest mistake is treating benchmarking as a reporting exercise. Benchmarks should trigger specific actions: creative refreshes, audience adjustments, format experiments, or competitive analysis deep-dives.
FAQ
What is a good CTR for Facebook ads in 2026?
The average CTR for Facebook traffic campaigns in 2026 is around 1.4–1.7%. A "good" CTR depends on your vertical — Shopping and Travel often exceed 2.5%, while Finance and Healthcare typically fall below 1%. Compare against your specific industry benchmark rather than cross-industry averages.
How long do Facebook ad creatives typically last before fatigue?
Most Facebook ad creatives show performance decline after 2–4 weeks of consistent delivery. High-frequency campaigns in competitive verticals may see fatigue in as little as 7–10 days. Monitoring competitor creative refresh rates with spy tools helps you plan replacement cycles proactively.
How can I benchmark my Facebook ad CPM against competitors?
Start with industry-average CPM data, then use ad spy tools like Adligator to analyze competitor ad longevity and format mix. Ads running for 30+ days typically signal strong CPM efficiency. Filter by your vertical and GEO to see which creative formats competitors use to maintain cost-effective delivery.
Are Facebook ads still cheaper than Google Ads in 2026?
Yes, significantly. Facebook traffic campaigns average $0.70 CPC versus $5.26 for Google Ads. Facebook lead campaigns average $27.66 CPL compared to $70.11 for Google. While Facebook costs are rising, the cost advantage remains substantial across nearly every vertical.
How often should I refresh Facebook ad creatives?
Base your refresh cycle on your vertical's fatigue timeline: every 7–14 days for niche B2B audiences, every 14–28 days for mid-size ecommerce audiences, and every 28–60 days for broad consumer campaigns. Use frequency metrics and CTR trends as early warning signals rather than waiting for ROAS decline.
Conclusion
Facebook ad benchmarks for 2026 paint a clear picture: costs are rising modestly, AI-driven optimization is lifting baseline performance, and creative quality is becoming the primary differentiator. For media buyers, the actionable takeaway is to stop treating benchmarks as static reference points and start using them as triggers for competitive analysis.
Know your vertical's CTR, CPM, CPC, and creative lifespan baselines. Compare your metrics against them quarterly. And when you find yourself below benchmark — or want to push above it — look at what top performers in your vertical are actually running.
That is where benchmarks end and competitive intelligence begins.
Ready to see which ads outperform benchmarks in your vertical? Start analyzing competitor ads for free with Adligator
See how Adligator helps media buyers beat industry benchmarks →