Facebook Ads Benchmarks by Industry in 2026: How to Use Competitive Data to Set Realistic KPIs
Every media buyer has asked the same question: "Is my CPC good or terrible?" Without context, your Facebook Ads metrics are just numbers. With industry benchmarks, they become a diagnostic tool.
This guide provides 2026 Facebook Ads benchmarks by industry — CTR, CPC, CPM, and conversion rates — and shows you how to use them correctly. More importantly, it explains why static benchmarks are only half the picture and how competitive intelligence fills the gap.
Whether you manage campaigns for e-commerce, SaaS, finance, or local services, these numbers give you a starting point. What you do with them determines whether you stay average or outperform.
Why Benchmarks Matter for Media Buyers
Benchmarks serve three critical functions for anyone running Facebook Ads:
1. Setting realistic expectations. If the average CPC in finance is $3.77 and your client expects $0.50, you have a misalignment problem that no amount of optimization will fix. Benchmarks prevent unrealistic goal-setting.
2. Diagnosing underperformance. A 0.8% CTR might seem low — until you learn that the legal industry averages 0.45%. Context transforms your read of every metric.
3. Identifying opportunities. If your industry averages a 2.5% conversion rate and you're at 1.8%, that gap represents a concrete optimization target. Without benchmarks, you wouldn't know the gap exists.
However, benchmarks have a fundamental limitation: they represent averages. The top 10% of advertisers in any vertical significantly outperform these numbers. Your goal shouldn't be to match benchmarks — it should be to beat them.
The question is: how do you know what the top performers are doing differently? That's where competitive intelligence enters the picture.
2026 Facebook Ads Benchmarks by Industry (CTR, CPC, CPM, CVR)
The following benchmarks are aggregated from multiple industry reports and platform data for Q1 2026. Use them as reference points, not absolute targets.
Cost Per Click (CPC) by Industry
- Apparel & Fashion: $0.45
- Auto: $2.24
- B2B / SaaS: $2.52
- Beauty & Personal Care: $1.81
- Consumer Services: $3.08
- E-commerce (general): $0.70
- Education: $1.06
- Finance & Insurance: $3.77
- Fitness & Wellness: $1.90
- Food & Beverage: $0.42
- Healthcare: $1.32
- Home & Garden: $2.78
- Legal: $1.32
- Real Estate: $1.81
- Retail: $0.70
- Technology: $1.27
- Travel & Hospitality: $0.63
Click-Through Rate (CTR) by Industry
- Apparel & Fashion: 1.24%
- Auto: 0.80%
- B2B / SaaS: 0.78%
- Beauty & Personal Care: 1.16%
- E-commerce (general): 1.59%
- Education: 0.73%
- Finance & Insurance: 0.56%
- Fitness & Wellness: 1.01%
- Food & Beverage: 1.20%
- Healthcare: 0.83%
- Legal: 0.45%
- Real Estate: 0.99%
- Retail: 1.59%
- Technology: 1.04%
- Travel & Hospitality: 0.90%
Cost Per Mille / CPM by Industry
- Apparel & Fashion: $7.19
- Auto: $12.61
- B2B / SaaS: $14.87
- E-commerce (general): $9.21
- Finance & Insurance: $17.90
- Food & Beverage: $5.21
- Healthcare: $10.08
- Real Estate: $13.50
- Retail: $8.36
- Technology: $11.43
- Travel & Hospitality: $6.84
Conversion Rate (CVR) by Industry
- Apparel & Fashion: 4.11%
- Auto: 5.11%
- B2B / SaaS: 2.31%
- Beauty & Personal Care: 3.47%
- E-commerce (general): 3.26%
- Education: 13.58%
- Finance & Insurance: 9.09%
- Fitness & Wellness: 14.29%
- Food & Beverage: 2.31%
- Healthcare: 11.00%
- Legal: 5.60%
- Real Estate: 10.68%
- Retail: 3.26%
- Technology: 2.31%
- Travel & Hospitality: 2.82%
What These Numbers Actually Mean
A few patterns stand out from the 2026 data:
- Lowest barrier to entry: Food & Beverage ($0.42 CPC) and Apparel ($0.45 CPC) remain the cheapest verticals to advertise in. But low CPC often correlates with lower average order values.
- Highest competition: Finance ($3.77 CPC, $17.90 CPM) and B2B/SaaS ($2.52 CPC, $14.87 CPM) reflect mature, high-value verticals where customer lifetime value justifies the cost.
- Best conversion potential: Education (13.58% CVR) and Fitness (14.29% CVR) have exceptionally high conversion rates, often due to lead-gen-focused campaigns where the conversion event is a form fill, not a purchase.
- Seasonal sensitivity: Travel & Hospitality benchmarks fluctuate most dramatically — CPMs can triple during peak booking seasons (January, June).
Key takeaway: High CPCs don't necessarily mean poor performance. Finance has one of the highest CPCs ($3.77) but also one of the highest conversion rates (9.09%). What matters is your cost per acquisition relative to customer lifetime value.
How to Interpret Benchmarks Correctly
Raw benchmark data is dangerous without proper interpretation. Here are the common mistakes and how to avoid them.
Mistake 1: Comparing across industries
A 1.5% CTR is exceptional in legal but mediocre in e-commerce. Always compare against your own vertical, not the overall average.
Mistake 2: Ignoring funnel stage
Top-of-funnel awareness campaigns naturally have lower CTR and higher CPM than retargeting campaigns. Compare benchmarks for the same campaign objective.
Mistake 3: Conflating platform-wide data with your GEO
US benchmarks differ dramatically from Southeast Asia or Eastern Europe. A $0.70 CPC in US e-commerce might be $0.15 in Vietnam. If your target market isn't primarily US/UK/CA/AU, standard benchmarks may not apply.
Mistake 4: Using last year's data
Facebook Ads costs fluctuate significantly year over year. CPMs rose 30-40% during 2024-2025 due to increased competition and iOS privacy changes. Using outdated benchmarks leads to wrong conclusions.
Mistake 5: Treating all campaign types equally
Prospecting campaigns, retargeting campaigns, and lookalike campaigns each have fundamentally different performance profiles. A retargeting campaign might achieve 5x the CTR of a prospecting campaign in the same vertical. When you see a "2.5% average CTR" benchmark, it's blending all campaign types — which makes it misleading for any specific campaign you're running.
The right approach
- Find your industry-specific benchmark
- Adjust for your target GEO and funnel stage
- Compare against your own historical data (week-over-week, month-over-month)
- Use benchmarks as diagnostic signals, not performance targets
Using Competitive Intelligence to Beat Industry Averages
Benchmarks tell you what average looks like. Competitive intelligence shows you what winners are doing. This is the critical difference.
Here's what you can learn from analyzing competitors' actual ads:
Ad longevity reveals profitable creatives
When a competitor runs the same ad for 30+ days, they're almost certainly profitable. Nobody sustains ad spend on losing campaigns. By tracking how long competitor ads stay active, you reverse-engineer their performance thresholds.
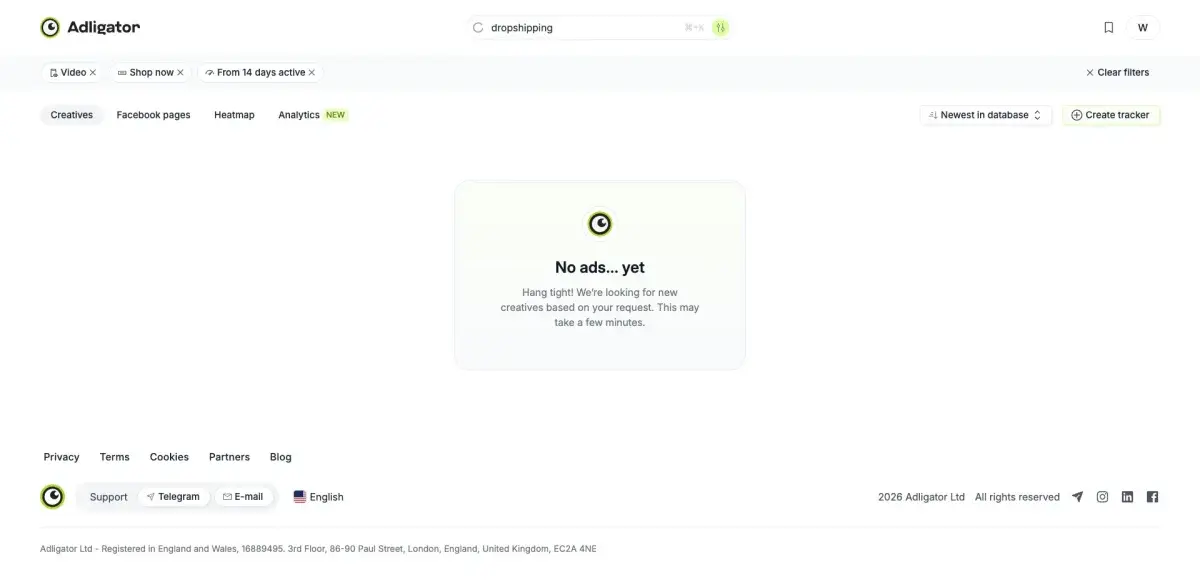
Tools like Adligator show exactly how many days each ad has been running, across which platforms and GEOs. This is data that no benchmark report provides.
Creative format patterns indicate what converts
If you notice that top competitors in your vertical are predominantly using video (not static images), that's a strong signal about what format converts best for your audience. This insight is more actionable than any CTR benchmark.
Placement strategy reveals optimization opportunities
Competitors running ads on Facebook, Instagram, and Audience Network simultaneously are likely using advantage+ placements or have tested and confirmed cross-platform performance. If they're only on Instagram, that tells you something too.
 Adligator reveals competitor ad performance signals that static benchmarks miss
See what your competitors' ads actually look like — try Adligator free
CTA button analysis reveals conversion strategy
If most competitors in your vertical use "Shop Now" versus "Learn More," that indicates the dominant conversion strategy — direct vs. consideration funnel. Aligning your approach with what's proven in your market can accelerate results.
Build Your Own Benchmark Dashboard with Spy Data
Instead of relying solely on published benchmarks, build a living competitive intelligence dashboard. Here's how:
Step 1: Identify your top 5-10 competitors
List advertisers who target the same audience in the same GEO. Include both direct competitors and adjacent players.
Step 2: Track their ad activity weekly
In Adligator, search by competitor Facebook page ID or by industry keywords. Note:
- Number of active ads
- Creative formats used (video vs. image vs. carousel)
- Average ad longevity (how many days active)
- CTA button types
- Platform distribution (Facebook vs. Instagram vs. Audience Network)
Step 3: Build your comparison framework
Create a simple spreadsheet with:
| Metric | Industry Benchmark | Your Current | Top Competitor Signal |
|---|---|---|---|
| CTR | 1.59% | 1.2% | Competitor uses video (you use static) |
| CPC | $0.70 | $0.95 | Competitor targets 3 GEOs (you target 1) |
| Ad longevity | N/A | 7 days avg | Top competitor: 30+ days |
| Creative variants | N/A | 2 | Top competitor: 8 |
Step 4: Set improvement targets
Based on the gap between your metrics and both industry benchmarks and competitor signals, set quarterly improvement targets. Example:
- Q2 target: Increase CTR from 1.2% to 1.5% by testing video creatives (based on competitor format analysis)
- Q2 target: Reduce CPC by 15% by expanding to 2 additional GEOs (based on competitor GEO strategy)
 Filter by industry-relevant parameters to build your own competitive benchmarks
Step 5: Review and update monthly
Benchmarks shift. Competitors change strategies. Your dashboard should be a living document, not a one-time exercise. Set a monthly calendar reminder to refresh your competitive data.
Advanced: Use trackers for automated monitoring
Adligator's live tracker feature lets you save search configurations and get alerts when new competitor creatives appear. This eliminates the manual monitoring overhead and ensures you never miss a strategic shift from key competitors.
FAQ
What is a good CTR for Facebook Ads in 2026?
The average CTR across all industries is approximately 1.49%. However, this varies significantly by vertical — retail and e-commerce see around 1.59%, while finance averages 0.56% and legal is even lower at 0.45%. A "good" CTR is one that beats your specific industry average and, more importantly, your own historical performance.
How often do Facebook Ads benchmarks change?
Benchmarks shift quarterly due to seasonal demand, algorithm updates, and competitive landscape changes. Q4 CPMs typically spike 20-40% due to holiday advertising competition. Review your benchmarks at least once per quarter against fresh data, and always cross-reference with competitive intelligence from actual ads in your vertical.
Can I use spy tools to create my own benchmarks?
Yes. Tools like Adligator let you analyze competitor ad longevity, creative formats, and placement strategies at scale. By tracking how long competitor ads run, you can infer what performance thresholds they consider profitable. This creates more relevant benchmarks than industry-wide averages because they reflect your actual competitive environment.
Why are my CPCs higher than the industry benchmark?
Several factors can drive above-average CPCs: narrow audience targeting, competitive niche keywords, low relevance scores, or targeting high-value GEOs like the US and UK. Before assuming underperformance, check whether your conversion rate compensates for higher CPCs — a $3 CPC with 10% conversion is often better than $0.50 CPC with 0.5% conversion.
Should I compare my metrics to global or regional benchmarks?
Always regional when possible. US/UK benchmarks can be 3-10x higher than Southeast Asian or Eastern European markets. If published benchmarks don't specify the region, assume they're US-weighted. Build your own regional benchmarks using competitive intelligence tools that let you filter by GEO.
Conclusion
Facebook Ads benchmarks by industry give you essential context for evaluating campaign performance in 2026. But benchmarks alone are static snapshots — they tell you where the average is, not where the winners are.
The real competitive advantage comes from combining benchmark data with live competitive intelligence. When you know not just the average CPC for your industry, but also exactly what creatives, placements, and strategies your top competitors are running profitably, you move from guessing to informed decision-making.
Use the benchmark data in this article as your baseline. Then layer on competitive intelligence to identify specific, actionable improvements.
Ready to see what your competitors are actually doing? Try Adligator free — see real competitor ads, creative strategies, and performance signals