How to Optimize Landing Pages Using Competitor Ad Spy Data: From Click to Conversion
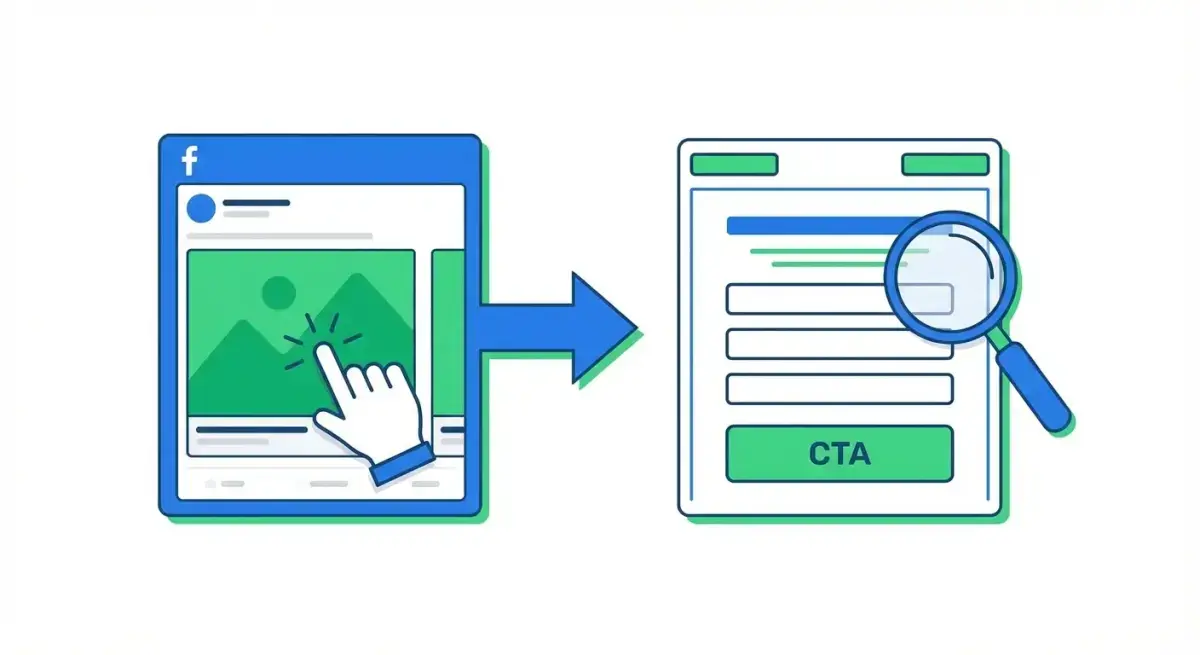
You can have the best ad creative in the world, but if your landing page doesn't deliver on the promise, you're burning budget. The disconnect between ad and landing page is one of the most common — and most expensive — problems in Facebook advertising.
Here's what most media buyers miss: your competitors have already tested landing page variations. Their long-running ads point to landing pages that convert. By analyzing the ad-to-page alignment of successful competitors, you can skip months of trial and error on your own landing page optimization.
This guide shows you how to use landing page optimization spy tools to systematically extract landing page insights from competitor ads — and turn those insights into higher conversion rates on your own pages.
Why Landing Page Optimization Starts with Ad Spy Data
Traditional landing page optimization is a slow, expensive process. You build a page, drive traffic, wait for data, run A/B tests, iterate, and repeat. Each cycle takes weeks and costs real budget.
Competitor ad spy data shortcuts this process in a specific way: it shows you which ad-to-page combinations survive. When a competitor runs the same ad for 30+ days, the landing page behind that ad is almost certainly converting. Otherwise, they'd have paused it.
This doesn't mean you copy their landing page. It means you extract the patterns:
- What promise does the ad make, and how does the page deliver it?
- Where is the CTA placed, and what does it say?
- How long is the page? Single screen or long-form?
- What trust signals appear above the fold?
- Does the page match the ad's visual language?
These patterns, aggregated across multiple competitors, give you a data-driven blueprint for your own pages.
What Ad-to-Landing-Page Alignment Reveals
The relationship between an ad and its destination page tells you more about what converts than either element alone.
 The five alignment checkpoints between a competitor's ad and their landing page.
Headline Continuity
The strongest-performing ad-to-page combinations maintain message consistency. If the ad says "Save 3 hours per week on reporting," the landing page headline should echo that specific benefit — not pivot to a generic "Welcome to our product."
When analyzing competitors, check:
- Does the landing page headline repeat or expand the ad's main promise?
- Is the same language used (not synonyms, the exact same words)?
- Does the emotional tone match?
If 4 out of 5 competitors maintain tight headline-to-ad consistency in their long-running campaigns, that's a pattern worth following.
CTA Alignment
Compare the ad's CTA button with the landing page's primary CTA:
- Ad says "Shop Now" → Page should have a prominent buy button above the fold. If the page instead asks for an email first, there's friction.
- Ad says "Learn More" → Page should educate before selling. Long-form content, video explanations, or case studies.
- Ad says "Sign Up" → Page should have a simple registration form. Minimal fields, clear value proposition.
Misalignment between ad CTA and page CTA is a conversion killer. When you see competitors maintaining tight alignment in their profitable ads, note exactly how they do it.
Offer Presentation
How the offer is structured on the landing page reveals what converts in your niche:
- Price-first: Competitors who show pricing immediately target bottom-funnel, price-conscious buyers.
- Value-first: Competitors who delay pricing focus on building perceived value and targeting quality-conscious buyers.
- Social-proof-first: Leading with testimonials or user counts works for products where trust is the primary barrier.
Track which presentation style correlates with the longest-running ads in your niche.
The Landing Page Analysis Framework
When you visit a competitor's landing page (via the destination URL in their ad), use this systematic framework to extract insights.
 Use this checklist to systematically analyze every competitor landing page you visit.
Above the Fold
This is the most critical real estate. Document:
- Headline: Word-for-word. How does it relate to the ad?
- Subheadline: Does it expand the promise or add specificity?
- Hero image/video: Product shot? Lifestyle? Demo? Screenshot?
- Primary CTA: Button text, color, placement, size
- Trust indicators: Logos, ratings, "As seen in," user counts
Page Structure
Scroll through and note:
- Total page length: Short (1-2 screens), medium (3-5 screens), or long-form (5+ screens)
- Section order: What comes first, second, third? Benefits → features → pricing → FAQ is common, but your niche may differ.
- Content type: Text-heavy, image-heavy, video-centric, or mixed
- Number of CTAs: How many times does the page ask for action?
Trust Architecture
What proof does the page offer?
- Customer testimonials (text, video, or both)
- Company logos ("Trusted by...")
- Star ratings or review scores
- Money-back guarantees
- Security badges
- Media mentions
Exit Intent and Secondary Offers
Many competitor pages include:
- Exit-intent popups with discounts or lead magnets
- Secondary CTAs for those not ready to buy ("Download our guide" vs "Buy now")
- Chatbots or live chat widgets
- Retargeting pixel indicators (check for Meta pixel, Google tag, etc.)
How to Extract Actionable Insights
Raw observations aren't useful until you synthesize them into actionable changes. Here's the process:
Step 1: Analyze 5-10 Competitor Landing Pages
Don't look at just one. You need enough data points to identify genuine patterns versus individual choices.
For each page, fill out the analysis framework above. Use a spreadsheet to compare side by side.
Step 2: Identify Consensus Patterns
Look for elements that appear across multiple competitors:
- If 7 out of 10 use video above the fold → video probably converts better than static images in your niche
- If most use short-form pages → your audience likely makes quick decisions
- If everyone leads with social proof → trust is the primary conversion barrier
Step 3: Identify Gaps
What's missing from competitor pages?
- No one addresses a common objection? Add it to yours.
- Everyone uses generic stock photos? Use real product images.
- No one offers a comparison table? Build one.
Gaps are your differentiation opportunities. Filling them gives you an edge competitors don't have.
Step 4: Build Your Optimization Roadmap
Prioritize changes by potential impact:
- High impact: Ad-to-page alignment fixes (headline consistency, CTA matching)
- Medium impact: Trust signal additions, offer restructuring
- Lower impact: Layout tweaks, color changes, button text variations
Start with alignment fixes — they typically produce the largest conversion improvements with the least effort.
How Adligator Reveals Landing Page Patterns
Manual competitor landing page analysis means clicking individual ads, waiting for pages to load, and manually tracking destination URLs. It works for a handful of competitors but doesn't scale.
 Adligator's URL and domain zone filters help you identify which landing page structures competitors use most.
Adligator accelerates landing page research in several ways:
- Destination URL visibility: Each ad card shows the landing page URL, so you can see where competitors send traffic without clicking every ad.
- Domain zone filter: Filter by .com, .io, .shop, etc. to identify landing page patterns by domain type. Affiliate marketers often use specific domain extensions — this filter reveals their funnel structures.
- URL/IP filter: Search for specific landing page URLs or IP addresses to find all ads pointing to the same page. This shows you which ads a competitor considers their best performers (highest volume pages).
- Days active filter: Combined with URL data, this reveals which ad-to-page combinations have the longest lifespan — your strongest signals for what converts.
- CTA button filter: See which CTA types competitors pair with different landing page styles.
The workflow: search for your niche, filter for ads running 10+ days, note the destination URLs, then visit those pages systematically. You're analyzing pages that are connected to proven ads, not random competitor pages.
Ready to analyze competitor landing pages? Start analyzing competitor landing pages — try Adligator free
Building a Landing Page Testing Roadmap from Spy Data
Once you've completed your competitor landing page analysis, translate your findings into a structured testing plan.
Priority Tier 1: Alignment Fixes (Week 1)
These are the highest-impact, lowest-effort changes:
- Match your landing page headline to your ad copy's main promise
- Ensure CTA button text matches the ad's CTA type
- Verify visual consistency between ad creative and page hero section
- Remove any navigation that distracts from the primary conversion goal
Alignment fixes alone can improve conversion rates by 10-30% because they eliminate the cognitive dissonance between what users expected (from the ad) and what they see (on the page).
Priority Tier 2: Structure Changes (Weeks 2-3)
Based on competitor patterns:
- Adjust page length to match what works in your niche (if competitors use short-form and you're using long-form, test shorter)
- Reorder sections to match the proven sequence (e.g., move social proof above the fold if competitors do)
- Add or remove form fields based on competitor conversion paths
- Implement the trust signals that appear consistently across competitor pages
Priority Tier 3: Differentiation Tests (Weeks 4+)
This is where you go beyond copying patterns:
- Test the gaps you identified — elements no competitor uses
- Experiment with alternative offer presentations
- Try unique trust signals (case studies instead of testimonials, interactive demos instead of screenshots)
- Test personalization based on ad source (different headlines for different ad campaigns)
Measuring Results
For each change, track:
- Conversion rate (primary metric)
- Bounce rate (are people staying?)
- Time on page (are they engaging?)
- Cost per conversion (is ROAS improving?)
Run each test for a minimum of 7 days or 100 conversions (whichever comes first) before drawing conclusions. Compare results against your baseline and against the competitor benchmarks you established during analysis.
Common Landing Page Mistakes Spy Data Exposes
Message Mismatch
Your ad promises one thing, your page delivers another. This is the #1 conversion killer and the easiest to fix with spy data — you can see exactly how successful competitors maintain consistency.
Too Many Choices
If every competitor uses a single, focused CTA and your page offers three different actions, you're creating decision paralysis. Spy data shows you the market's consensus on simplicity.
Missing Trust Signals
When competitors with long-running ads all include testimonials and you don't, that's a clear signal. Trust isn't optional — it's a conversion requirement.
Ignoring Mobile
Over 80% of Facebook ad traffic lands on mobile devices. If competitor pages are optimized for mobile (fast load, thumb-friendly CTAs, minimal scrolling) and yours isn't, you're losing conversions to basic UX.
Slow Load Times
Spy data can't directly show you competitor page speed, but here's the indirect signal: if competitors with long-running ads use lightweight pages (minimal JavaScript, optimized images, simple layouts), speed matters in your niche. Check your own page speed against these benchmarks. Every second of load time costs you approximately 7% in conversion rate.
No Mobile-Specific Optimization
Mobile users behave differently — they scroll faster, have less patience, and use thumbs instead of cursors. If competitor pages show mobile-specific elements (sticky CTA buttons, tap-to-call, accordion FAQs), your page needs them too.
Static Optimization
Landing pages aren't "set and forget." Competitors continuously test. If you analyzed their pages three months ago and haven't checked since, you're operating on stale intelligence. Make competitor landing page analysis a monthly habit.
FAQ
How does ad spy data help with landing page optimization?
Ad spy tools reveal the destination URLs competitors use, showing which landing page structures pair with long-running (likely profitable) ads. By analyzing the ad-to-page alignment of successful competitors, you can identify proven patterns for headlines, CTAs, layouts, and messaging that convert.
What should I look for on competitor landing pages?
Focus on five elements: headline consistency with the ad, CTA placement and copy, page structure and length, trust signals (testimonials, badges, guarantees), and the offer presentation. Compare these across multiple competitors to find patterns.
How often should I analyze competitor landing pages?
Monthly for a thorough review, with weekly spot-checks on top competitors. Landing pages change frequently as competitors run tests, so stale data can be misleading. Focus on pages paired with ads running 14+ days — they're more likely optimized.
Conclusion
Facebook ad landing page optimization doesn't happen in isolation. The most effective approach uses competitor ad spy data to understand what the market has already validated — then builds on those patterns with your own differentiation.
Start with ad-to-page alignment. Analyze 5-10 competitor pages using the framework in this guide. Identify consensus patterns, find gaps, and prioritize your optimization roadmap. The data is there — your competitors have already spent the budget to test what works.
Ready to see what's behind your competitors' best ads? Start analyzing competitor landing pages — try Adligator free