How to Track Competitor Facebook Ad Frequency and Creative Rotation to Time Your Campaign Launches
Every media buyer obsesses over what creative to run. Fewer ask the more profitable question: when should I run it?
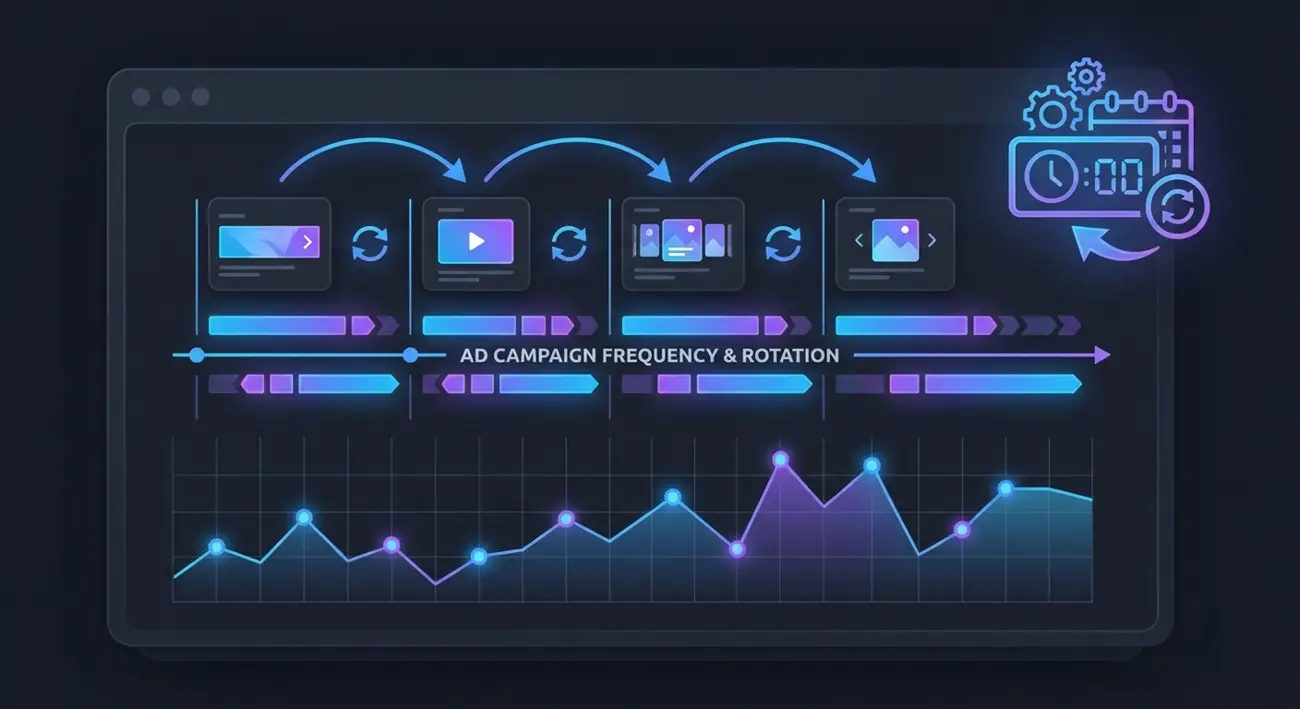
Competitor Facebook ad frequency tracking gives you the timing intelligence most advertisers miss entirely. By monitoring how often competitors launch new creatives, how long they run them, and when they rotate — you can time your own campaigns to hit the market at the exact moment competitors fatigue their audiences.
This guide breaks down a practical framework for tracking competitor ad frequency and creative rotation patterns using spy tools. You'll learn to read lifecycle signals, detect saturation before it tanks your ROAS, and build a timing dashboard that turns competitive data into launch decisions.
Why Ad Frequency and Creative Rotation Data Matters
Ad frequency isn't just a metric inside your own campaigns. It's a market-level signal.
When multiple competitors hammer the same audience with similar creatives for weeks, that audience develops banner blindness. Your fresh creative entering a fatigued market costs less and converts better. But if you launch into a market where competitors just refreshed their creatives, you're fighting for attention against peak-performance ads.
Here's what frequency and rotation data tells you:
- Market saturation levels — how many competitors are active and how aggressively they're spending
- Creative lifecycle norms — how long ads typically survive in your vertical before performance drops
- Rotation velocity — how fast competitors swap creatives, indicating testing speed and budget
- Launch windows — gaps between competitor creative refreshes where your ads face less competition
Most media buyers track none of this. They launch when their creative is ready, not when the market is ready. That's a timing mistake you can fix with the right data.
Understanding Competitor Ad Lifecycle Patterns
Every Facebook ad follows a predictable lifecycle. Understanding this pattern is the foundation for competitive timing analysis.
Phase 1: Launch (Days 1-3) The ad enters the auction. Meta's algorithm is exploring placements and audiences. Performance data is volatile. In spy tools, you'll see the ad appear with a "first seen" date.
Phase 2: Scaling (Days 4-14) If the ad performs, the advertiser increases budget. The creative reaches broader audiences. This is when spy tools show the ad appearing across more GEOs and placements.
Phase 3: Maturity (Days 14-30+) Performance stabilizes, then gradually declines. Audience overlap increases. The advertiser either maintains spend or begins planning a replacement. Spy tools show the ad has been active for weeks with no new variations.
Phase 4: Fatigue and Retirement (Day 30+) Click-through rates drop. The advertiser kills the ad or drastically reduces budget. In spy tools, the ad stops appearing in fresh crawls — the "last seen active" date stops updating.
 The four phases of a Facebook ad lifecycle — understanding this pattern is key to competitive timing.
The key insight: you can track where competitors are in this lifecycle using spy tool data. An ad that's been running for 25+ days is likely entering fatigue. That's your window.
How to Track When Competitors Launch and Kill Ads
The Meta Ad Library shows currently active ads but provides zero historical context. You can see what's running right now, but you can't see when it launched, how long previous ads ran, or when they were retired.
This is where manual tracking falls apart. Checking the Ad Library daily for five competitors means:
- Opening 5+ pages every morning
- Mentally noting which ads are new versus previously seen
- Trying to remember when specific ads appeared or disappeared
- No record of historical patterns over weeks or months
It's unsustainable beyond a single competitor, and the data quality degrades fast when you rely on memory.
What spy tools track that Ad Library doesn't:
| Data Point | Ad Library | Spy Tools |
|---|---|---|
| Currently active ads | ✅ | ✅ |
| First seen / launch date | ❌ | ✅ |
| Days active (longevity) | ❌ | ✅ |
| Last seen active date | ❌ | ✅ |
| Historical ad archive | ❌ | ✅ |
| GEO expansion over time | ❌ | ✅ |
| Multiple competitor tracking | Manual only | ✅ |
Step-by-step tracking workflow:
- Identify your top 5-10 competitors by Facebook page ID. You can find page IDs in the Ad Library URL or through spy tools.
- Set up saved searches or trackers for each competitor page ID in your spy tool.
- Filter by creation date to see only recently launched ads (last 7-14 days).
- Sort by "days active" to identify ads in scaling vs. maturity vs. fatigue phases.
- Log patterns weekly — note launch dates, creative types, and estimated retirement dates.
The goal is building a timeline view of each competitor's ad activity. Over 4-6 weeks, clear patterns emerge: weekly launch cadences, monthly rotation cycles, and seasonal spikes.
Reading Creative Rotation Signals from Spy Data
Creative rotation speed is one of the most underused competitive signals. How fast a competitor cycles through creatives tells you about their testing velocity, budget, and strategy sophistication.
Fast rotation (new creatives every 3-7 days):
- Indicates aggressive testing or a scaled operation with a dedicated creative team
- Suggests the advertiser hasn't found a clear winner yet, or they're proactively preventing fatigue
- Your opportunity: their audience sees constant variety, so your creative needs to be genuinely different — not just another variation
Moderate rotation (new creatives every 7-21 days):
- The most common pattern for profitable campaigns
- Suggests the advertiser found working angles and is methodically testing variations
- Your opportunity: identify the creative themes that persist across rotations — those are the proven angles worth learning from
Slow rotation (same creatives for 21+ days):
- Either the creative is a unicorn performer, or the advertiser is under-resourced
- Check "days active" — if the ad has been running 30+ days with no new variations from the same page, it's likely fatiguing
- Your opportunity: this competitor's audience is primed for fresh creative. Launch a differentiated angle into the same audience
 Common creative rotation patterns and what they reveal about competitor strategy.
How to measure rotation speed:
- Search for a competitor's Facebook page ID in your spy tool
- Filter results by the last 30 days
- Count the number of unique creatives launched
- Divide 30 by the creative count = average days between launches
Example: If a competitor launched 8 creatives in 30 days, their rotation speed is ~3.75 days. That's fast — they're either testing aggressively or burning through creatives due to fatigue.
Rotation pattern red flags:
- Sudden increase in rotation speed → their winning creative just died, and they're scrambling
- Multiple similar variations launched simultaneously → they're split-testing angles, and the winner will emerge in 7-10 days
- Complete creative style change → they're pivoting strategy, possibly due to audience fatigue or policy changes
Using Frequency Patterns to Time Your Launches
Now that you can read competitor frequency and rotation data, here's how to convert it into launch timing decisions.
Strategy 1: Counter-cycle launching
Launch your campaigns when competitors are in the fatigue phase (Phase 4). Their audiences have seen the same creatives for weeks and are primed for something new. Your fresh creative enters with a natural advantage.
How to identify the window:
- Monitor competitor ads that have been active 20+ days with no new variations
- Check if the competitor's new ad launches have slowed down
- Look for decreased GEO presence (they're pulling back from marginal markets)
Strategy 2: Gap exploitation
Identify periods when competitors reduce ad activity. This could be weekly patterns (less activity on weekends), monthly patterns (budget resets), or seasonal patterns (post-holiday pullback).
How to spot gaps:
- Track competitor launch dates over 4+ weeks
- Map launches to a calendar view
- Look for consistent quiet periods
Strategy 3: Parallel timing
Sometimes the best move is launching alongside competitors — specifically when a market is growing and competitors are in early scaling (Phase 2). Their increased activity signals market demand, and there's room for multiple advertisers.
When to use this:
- Competitor creative is clearly working (active 7-14 days and expanding to new GEOs)
- The angle is broad enough for differentiation
- You have a genuinely distinct value proposition or creative approach
Strategy 4: Pre-emption
If you can identify a competitor's rotation rhythm (e.g., new creatives every Monday), launch your best creative 1-2 days before their expected refresh. You get first-mover advantage in the auction before their fresh creative enters.
This requires at least 4 weeks of tracking to establish reliable patterns, but it's the most aggressive timing play available.
Identifying Market Saturation Before It Hits Your Campaigns
Market saturation is the silent ROAS killer. By the time you notice your own performance dropping, the market has been saturated for days or weeks. Tracking competitor frequency data lets you detect saturation early.
The five saturation signals:
- Rising competitor count. More advertisers entering your keywords and audience segments. Track how many unique Facebook pages are running ads with similar keywords or in similar categories.
- Shortened ad lifespans. When the average "days active" drops across multiple competitors, it means creatives are burning out faster — a classic saturation indicator.
- Increased rotation velocity. Multiple competitors speeding up their creative rotation simultaneously signals that everyone's fighting fatigue, not just one advertiser.
- Creative convergence. When competitor ads start looking similar (same hooks, same visual styles, same CTAs), the audience is being hit with repetitive messaging from multiple sources.
- GEO contraction. Competitors pulling back from secondary GEOs to concentrate budget on primary markets. This shows up in spy tools as fewer GEO flags per ad over time.
Building a saturation score:
Create a simple 1-5 score for each signal and track it weekly:
- 1 point: Rising competitor count (3+ new advertisers in your niche this month)
- 1 point: Average ad lifespan dropped below 14 days
- 1 point: Average rotation speed increased by 30%+ versus prior month
- 1 point: 3+ competitors running visually similar creatives
- 1 point: Top competitors showing fewer GEOs than 30 days ago
Score interpretation:
- 0-1: Market is healthy — launch confidently
- 2-3: Market is warming — launch with differentiated creative and monitor closely
- 4-5: Market is saturated — consider delaying launch, pivoting creative angle, or targeting secondary GEOs competitors are abandoning
Building a Competitive Timing Dashboard
A timing dashboard turns raw spy tool data into actionable launch signals. Here's how to build one using a spreadsheet and your spy tool data.
Dashboard columns:
| Column | Data Source | Update Frequency |
|---|---|---|
| Competitor name | Manual entry | One-time |
| Facebook page ID | Ad Library / spy tool | One-time |
| Active ad count | Spy tool search | Weekly |
| Newest ad launch date | Spy tool (sort by newest) | Weekly |
| Oldest active ad (days) | Spy tool (days active filter) | Weekly |
| Avg rotation speed | Calculated (ads per 30 days) | Monthly |
| GEO count (latest ads) | Spy tool card data | Weekly |
| Saturation score (1-5) | Calculated from signals | Weekly |
| Launch recommendation | Based on analysis | Weekly |
Weekly update workflow (20 minutes):
- Open your spy tool. Search each competitor's page ID filtered to last 30 days.
- Count active ads. Note the newest launch date.
- Check the oldest active ad — how many days has it been running?
- Update your saturation score based on the five signals.
- Write a one-line launch recommendation: "Go," "Wait," or "Go with differentiated angle."
After 4 weeks of tracking, you'll have enough historical data to identify patterns and make confident timing calls.
Automation tip: If your spy tool supports saved trackers or alerts, set them up for each competitor page ID. This cuts your weekly update time in half — the tool flags new launches automatically, and you just need to log the data.
How Adligator Tracks Ad Lifecycle and Frequency Patterns
Adligator makes competitor Facebook ad frequency tracking practical by providing the specific data points this workflow requires.
Creation date tracking: Every ad in Adligator's database has a "first seen" date. Use the creation date range filter to isolate ads launched within specific windows — last 7 days, last 14 days, or custom ranges. This is the foundation for tracking competitor launch cadences.
Days active filter: Filter by minimum and maximum days active to segment competitors' ads by lifecycle phase. Want to find ads in the fatigue zone? Filter for 25+ days active. Looking for fresh launches? Filter for 1-3 days active.
Facebook page monitoring: Search by Facebook page ID to see all ads from a specific competitor. Combined with date filters, this gives you a complete timeline of their creative activity. Adligator supports tracking multiple competitor pages.
Last seen active: This filter shows when an ad was last detected as running. An ad with a "last seen active" date of 7+ days ago is likely dead — even if it ran for 30+ days before that. This helps you identify exactly when competitors retire creatives.
 Adligator's creation date and days active filters make competitor frequency tracking straightforward.
Live filter trackers: Save your competitor monitoring searches as persistent trackers (Pro plan: 7 trackers, Team plan: 14 trackers). Instead of manually re-running searches each week, trackers watch for changes and surface new ads from monitored competitors. This is the most efficient way to maintain your timing dashboard without daily manual checks.
GEO and platform data: Each ad card shows the countries and Meta placements where the ad runs. Track GEO expansion and contraction over time to gauge competitor confidence in a creative — expanding GEOs means it's working, contracting means it's dying.
Practical setup for frequency tracking:
- Go to Adligator's Creatives tab
- Enter a competitor's Facebook page ID in the search bar
- Set creation date to the last 30 days
- Sort by "Newest in database"
- Note the total ad count and launch dates
- Repeat for each competitor
With the Pro or Team plan's tracker feature, you can automate step 2-4 for each competitor, turning a 20-minute weekly task into a quick dashboard review.
FAQ
Can spy tools show exactly when a competitor launched an ad?
Most spy tools record the first date an ad appeared in their database, which closely approximates the launch date. While this isn't the exact second Meta approved the ad, it's accurate enough for competitive timing analysis — usually within 24-48 hours of the real launch. For frequency tracking purposes, this precision is more than sufficient.
How often should I check competitor ad changes?
For active campaigns, check at least twice per week. During peak seasons or when preparing a launch, increase to daily checks. Using a spy tool with saved trackers eliminates the need for manual checking entirely — the tool monitors competitors continuously and flags new activity, reducing your workload to reviewing alerts and updating your timing dashboard.
What signals indicate market saturation in a niche?
Key saturation signals include: multiple competitors running similar creatives simultaneously, shortened ad lifespans across the board, increased creative rotation speed, a spike in new advertisers entering the space, and competitors contracting their GEO targeting. When you see three or more of these signals together, the market is likely saturated — consider delaying your launch or pivoting to a differentiated creative angle.
Conclusion
Competitor Facebook ad frequency tracking transforms your launch strategy from guesswork to precision. Instead of launching when your creative is ready, you launch when the market is ready — hitting fatigued audiences with fresh angles while competitors struggle with declining performance.
The framework is straightforward: track competitor ad lifecycle phases, read creative rotation signals, detect saturation early, and time your launches to exploit competitive gaps. Whether you counter-cycle against fatigued competitors, exploit activity gaps, or pre-empt predictable rotation schedules, the data is available through spy tools.
Start by monitoring your top 5 competitors weekly. Build a simple timing dashboard. After 4 weeks, you'll see patterns that change how you plan every campaign launch.
Ready to track competitor ad frequency? Track competitor ad frequency with Adligator — start free