
How Much Does Gymshark Spend on Facebook Ads? A Reverse-Engineered Estimate
Someone in a meeting is going to ask you how much a competitor spends on Meta. You have two options: shrug, or give a number you can defend.
This article does the second thing. We take one named brand — Gymshark, the UK gym-apparel company that grew up on social — pull every public signal about its Meta advertising, and build a spend range from them. Then we hand you the method for whoever you actually compete with.
The honest framing first: nobody outside Gymshark knows how much Gymshark spends on Facebook ads. What follows is an estimate with stated assumptions, not a leaked figure — but it beats a guess, because every input is something you can verify yourself in twenty minutes.
Why you can never see the exact number — and what you can see
Meta publishes spend data in exactly two situations: ads about social issues, elections or politics, and some EU-delivered ads under the Digital Services Act. A gym-leggings ad in the UK falls into neither bucket, so there is no currency figure anywhere.
What Meta does publish, for every commercial advertiser, is the creative itself: the copy, the format, the countries it runs in, the day it launched and whether it is still running. That is the raw material — because spend leaves fingerprints. An advertiser cannot run an ad for five months in eight countries without paying for five months of delivery in eight countries. You can't see the invoice, but you can see the footprint the invoice paid for.
Four signals carry almost all the information:
- Library size — how many distinct ads the page has run. A proxy for creative production budget and testing appetite.
- Longevity (days active) — how long individual creatives stay live. Nobody funds weeks of unprofitable delivery, so long-running ads are the ones carrying real budget.
- Country count — how many markets a single campaign targets. Breadth multiplies cost.
- Creative duplication (copies) — the same creative running many times over, which is what scaling a winner physically looks like in the Ad Library.
None of these is money. All of them are shaped by money. Let's read Gymshark's.
Step 1: size the library
Start with the page, not the keyword. A brand-name search returns everyone who mentions the brand. You want the advertiser's own page.
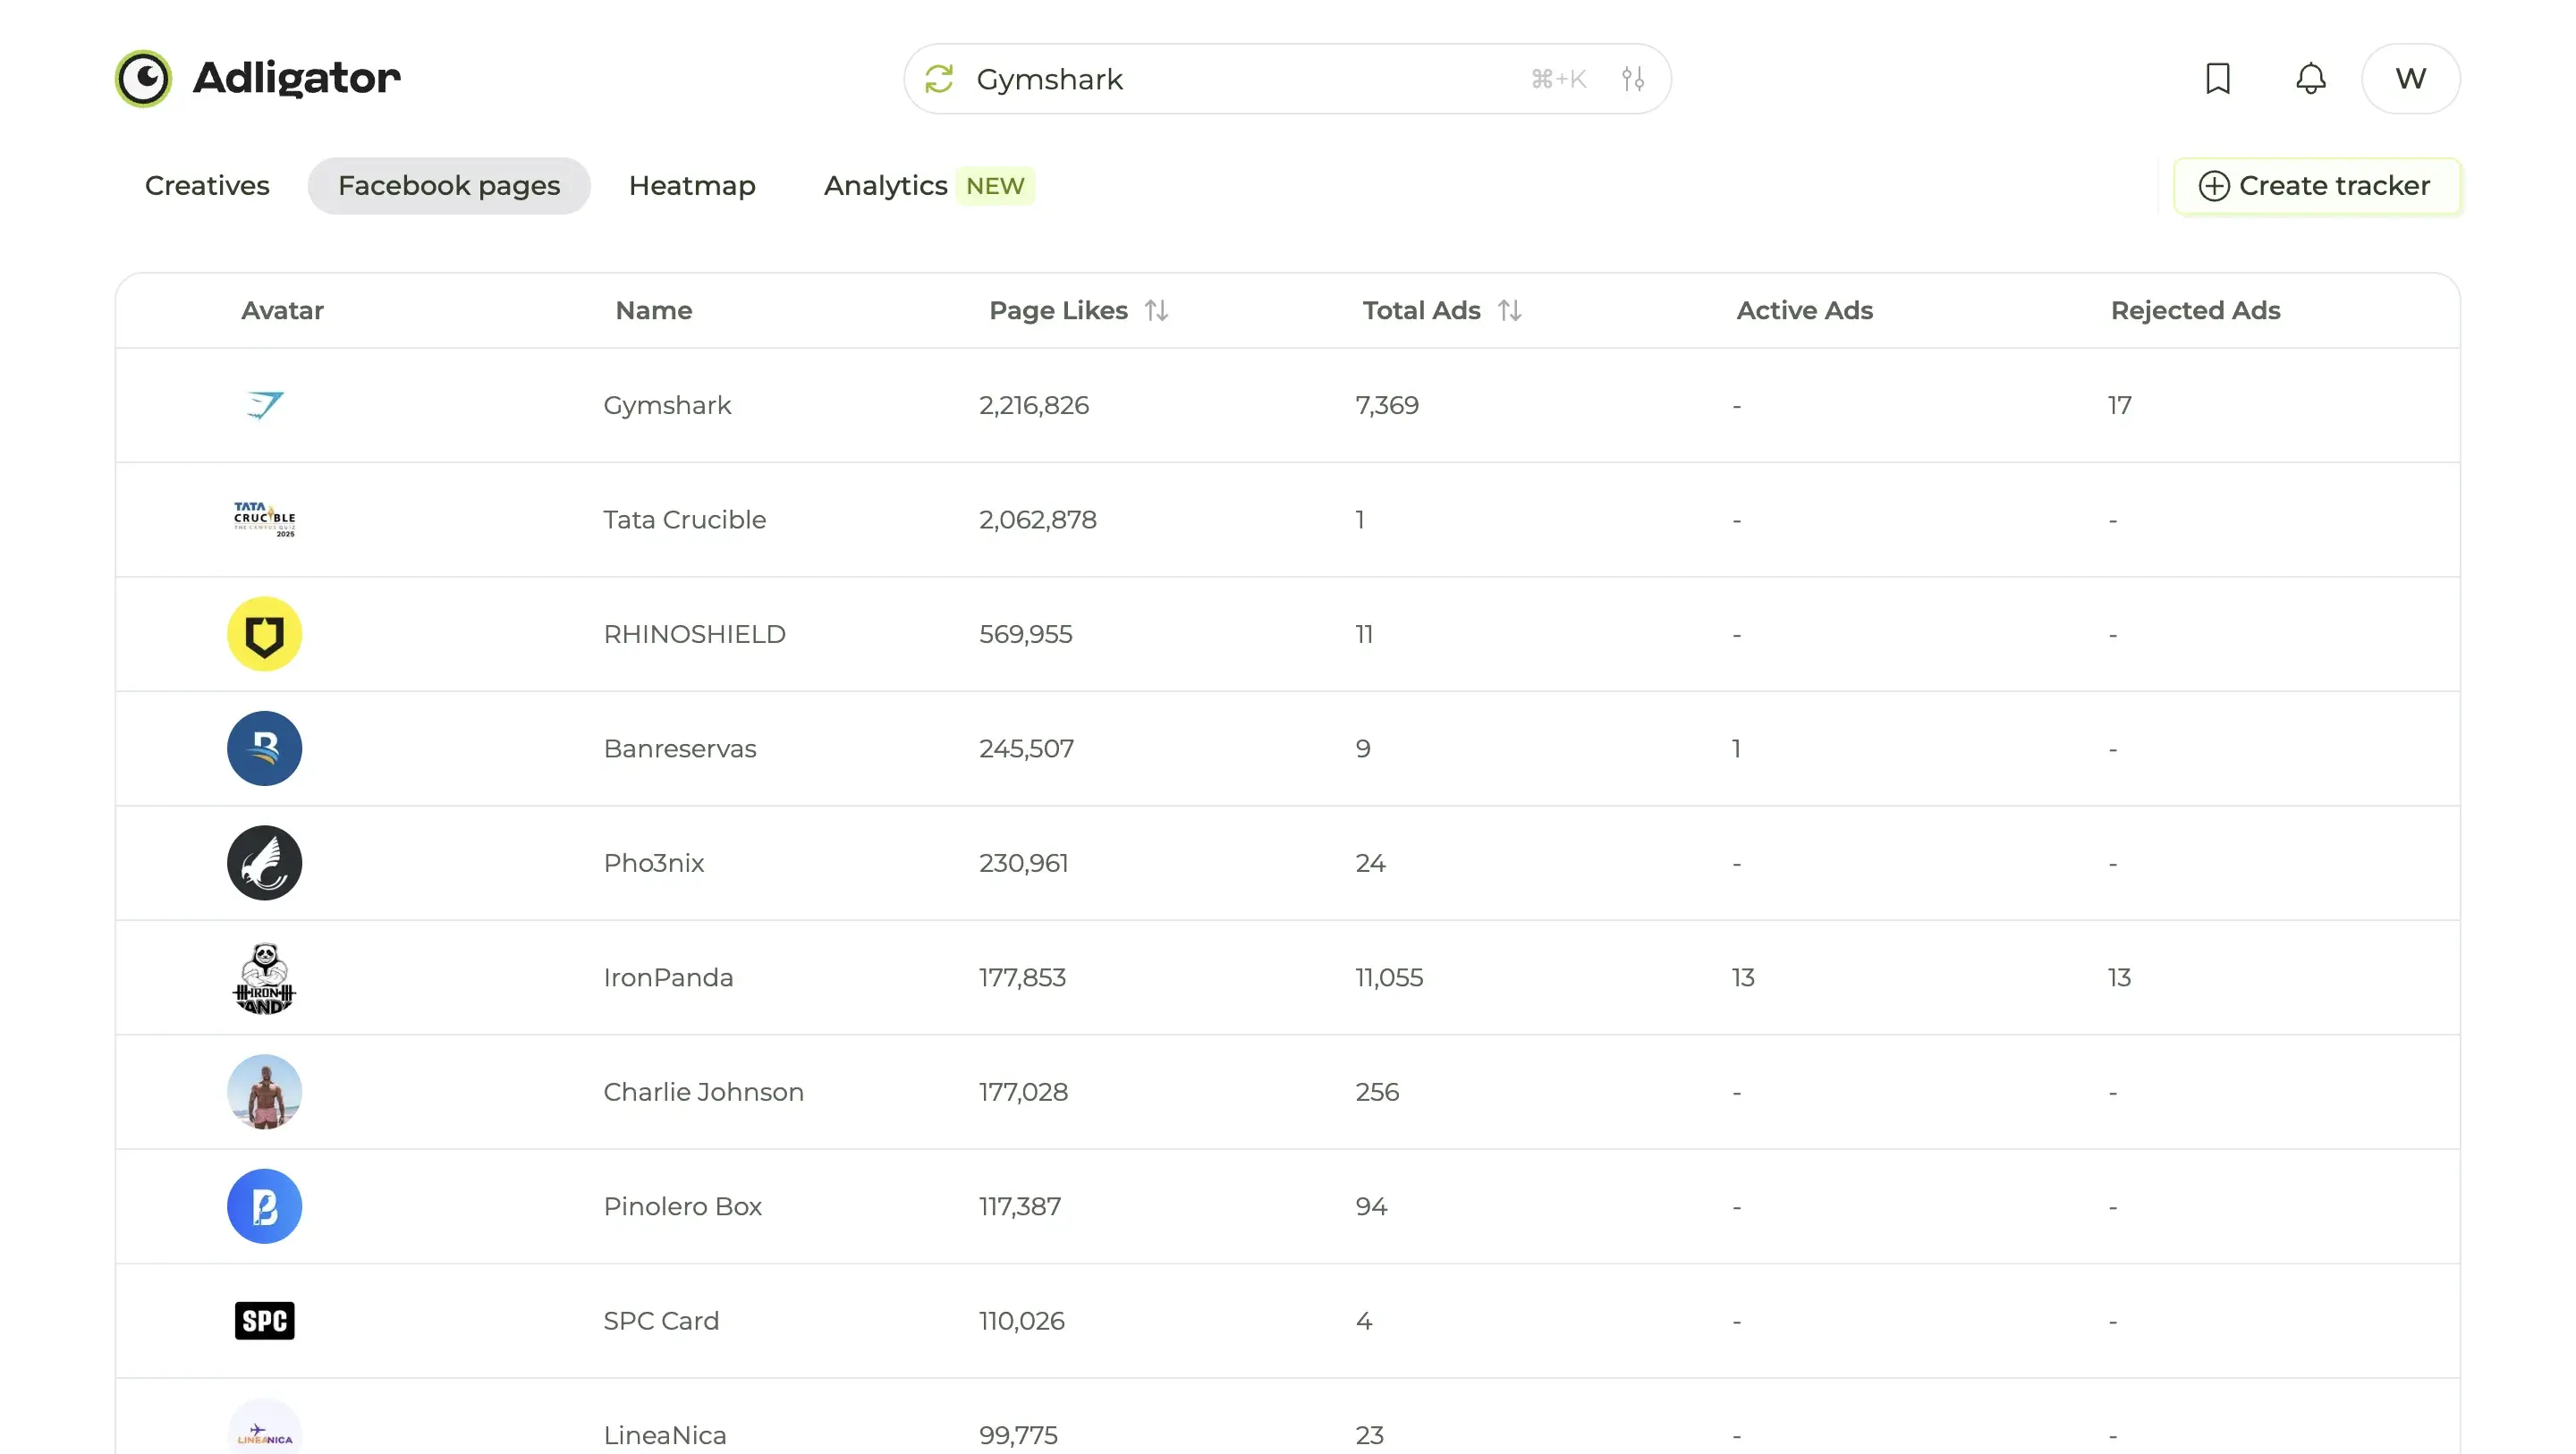 The Facebook pages tab: Gymshark's page carries 2,216,826 likes and 7,369 ads in Adligator's library.
Two numbers matter on that row. Gymshark's page has 2,216,826 likes and 7,369 total ads recorded against it. Read that second figure correctly: it is the page's whole advertising history, not ads matching the search term — a lifetime library count, which is exactly what we want.
Seven thousand ads is a serious operation — most other pages on the same search sit between 1 and 30. Gymshark runs an always-on creative machine, and always-on machines cost money whether or not any single creative wins.
Step 2: read longevity, because longevity is the profit signal
Now sort the page's creatives by how long they have been running.
 Sorted by longest running, Gymshark's top creatives sit at 147 and 143 days — evergreen controls, not tests.
The top creatives have been live for 147 days. Several sit at 143 and 135. In media-buying terms that is not a test — a test dies in a week. Those are evergreen control creatives that have paid their way for roughly five months.
Two more details on those cards matter for the estimate. The top creatives run in 2–3 countries each, and several deeper in the library span 15 countries at once — breadth is a budget multiplier. And multiple cards read "2 ads use this creative and text": duplication is what pushing budget into a winner looks like from the outside.
Longevity separates real spenders from brands with a big ad count and no commitment. Ten thousand seven-day ads is churn. Seven thousand ads with five-month controls is a funded programme.
Step 3: map the countries — and be surprised
The country breakdown is where the estimate gets its geography, and where Gymshark gets genuinely interesting.
 Twelve months of Gymshark delivery: the Netherlands, the UK and France lead, with the US fourth.
Over the last twelve months, ads recorded per country:
| Rank | Country | Ads | Rank | Country | Ads |
|---|---|---|---|---|---|
| 1 | Netherlands | 1,006 | 6 | Canada | 378 |
| 2 | United Kingdom | 948 | 7 | Australia | 256 |
| 3 | France | 918 | 8 | Spain | 102 |
| 4 | United States | 793 | 9 | UAE | 42 |
| 5 | Germany | 678 | 10 | Saudi Arabia | 42 |
Twenty countries in total, around 5,250 ad-country records, and roughly 85% of all activity concentrated in five markets. The Netherlands out-ranking the United States is the kind of finding that never shows up in a press release — it points at a European push rather than an American one.
For the estimate, the takeaway is that this is a five-market always-on programme with a long tail, not a global blanket buy. That changes the arithmetic: five Tier-1 markets is expensive but bounded.
Soft CTA: Run this method on your own competitor — start free on Adligator
Step 4: turn signals into a number (with the assumptions on the table)
Here is where most articles either invent a figure or refuse to give one. Do neither. The signals tell you the shape of the spend; the magnitude has to be anchored to something with a currency sign on it. That anchor is published financials.
Gymshark reported £646 million in revenue for the year to 31 July 2025, up from £607.3 million the year before, with pre-tax profit compressed to around £7 million as the company reinvested heavily — much of it into stores, festivals and physical activations rather than pure media.
Now the model, with every assumption stated:
- Total marketing spend. Scaled DTC apparel brands typically run total marketing at 8–15% of revenue. On £646m that is £52m–£97m a year.
- Paid media share. Gymshark is explicitly a community-and-creator-led brand — athlete partnerships, organic social, retail. Paid media is a minority of that budget. Assume 30–50% → £16m–£48m a year in paid media.
- Meta's share of paid media. For a DTC apparel brand with this creative footprint — five core markets, catalogue and DCO formats, Instagram-heavy placements — Meta typically takes 40–60% of paid social and a large slice of total paid. Assume 45–65% → £7m–£31m a year on Meta.
That gives a working estimate of roughly £7m–£31m a year, or £0.6m–£2.6m a month, on Meta — with the midpoint sitting near £1.5m a month, concentrated in the Netherlands, the UK, France, the US and Germany.
Sanity-check it against the signals. Would £150k a month produce ~5,250 ad-country records across 20 countries and five-month controls in five Tier-1 markets? No — not at that breadth. Would £15m a month? That implies far more concurrent creative volume than the library shows. The range survives, which is the only validation available.
Say it out loud when you present it: this is a modelled range, accurate to roughly a factor of two. That is honest, and still enough to answer the question that changes decisions — are they outspending you by 3x or by 30x?
Step 5: the mistakes that wreck these estimates
Five ways this goes wrong, all of them avoidable:
- Counting brand mentions as brand ads. A brand-name keyword search pulls in resellers, affiliates and influencers. Filter to the advertiser's own page ID first.
- Reading page-level columns as keyword-level results. In a Facebook pages list, the total/active/rejected columns describe the page's whole library, not the ads matching your search. Quoting them as keyword volume inflates your number by an order of magnitude.
- Treating ad count as spend. A thousand seven-day tests can cost less than twenty ads that ran all year. Weight by longevity.
- Ignoring the country multiplier. The same creative in 15 countries is not one ad's worth of budget.
- Forgetting that CPM is not flat. Impressions cost different amounts by market — and since 2026, Meta's location fees add 2–5% in six countries.
The manual version of all this is real work: open the Ad Library, scroll, screenshot, note launch dates in a spreadsheet, repeat monthly. It works for one competitor for one week. It cannot aggregate the three things the estimate depends on — days-active distribution, country breakdown, duplication count. That is the gap ad intelligence closes: one page, one view, every signal already counted.
What to do with the number once you have it
An estimate is only useful if it changes a decision. Three that it should:
- Budget sizing. If a competitor is at 20x your spend, stop competing on breadth. Pick one market and one angle and win it before you widen.
- Creative cadence. Their longevity distribution tells you the testing pace the category rewards. Five-month controls means the category tolerates evergreen creative — you do not need forty new assets a month to compete. At the other extreme sits Temu's disposable creative machine, where nothing live has run longer than a week.
- Market selection. The country table shows where the money goes. The interesting play is usually the market they under-serve, not the one they dominate. To dismantle the creatives themselves, see our guide to breaking down winning Facebook ad examples and the hook patterns that keep long-running ads alive.
FAQ
Can you see exactly how much Gymshark spends on Facebook ads?
No. Meta only publishes spend figures for ads about social issues, elections or politics, and for some EU-targeted ads under the Digital Services Act — and even then as broad ranges. For a commercial apparel brand like Gymshark, no exact spend number is public. Everything else is an estimate built from observable signals.
What signals can you actually see for a competitor's Facebook ads?
Four that matter: how many ads the page has run in total, how long individual creatives stay live, how many countries each campaign targets, and how many duplicates of the same creative are running. Together they tell you the shape and scale of the spend, even though none of them is a currency figure.
How accurate is a reverse-engineered ad spend estimate?
Treat it as an order of magnitude, not a number. A well-built estimate combining public revenue, category media-spend ratios and observed activity usually lands within a factor of two — enough to answer "are they outspending me 3x or 30x", which is the question that actually changes your plan.
Does the Meta Ad Library show ad budgets?
Only for the restricted categories above, and for some EU-delivered ads where DSA transparency applies — always as a range, never an account total. For everything else the Ad Library shows creatives, run dates and status, which is exactly why the signal-based method exists.
Conclusion
So — how much does Gymshark spend on Facebook ads? Our reverse-engineered answer is roughly £0.6m–£2.6m a month, weighted toward the Netherlands, the UK, France, the US and Germany, delivered through a library of some 7,000 ads with five-month evergreen controls at the top. It is an estimate, it carries a factor-of-two error bar, and every assumption behind it is written above so you can argue with it.
The number matters less than the method. Library size, longevity, country spread and creative duplication are public for every advertiser on Meta — including yours, and including the competitor whose budget your boss keeps asking about. Anchor those signals to a revenue figure, state your assumptions, and you have an estimate you can put in a deck and defend. For more methods and cross-checks, see our full guide on estimating competitor Facebook ad spend.
Ready to run this on your own competitor? Pull their whole ad library, longevity and country breakdown — free on Adligator.
Sources consulted: Adligator ad library, Gymshark page data captured 2 August 2026; Gymshark FY25 results coverage (sgieurope.com, modaes.com); Meta Ad Library transparency documentation.
Related Reading
- How to Estimate Competitor Facebook Ad Spend Using Spy Tools and Ad Library Data
- How to Use Ad Spy Data to Scale Facebook Campaigns: From Testing to Six-Figure Spend
- How to Build a Facebook Ad Creative Testing Framework Using Competitor Spy Data
- Facebook Ad Performance Benchmarks by Vertical in 2026: CPM, CTR, and Creative Lifespan Data for Media Buyers
- Inside Temu's Facebook Ads Machine: A Media Buyer's Teardown
